
Step 1
Read the trajectory lines
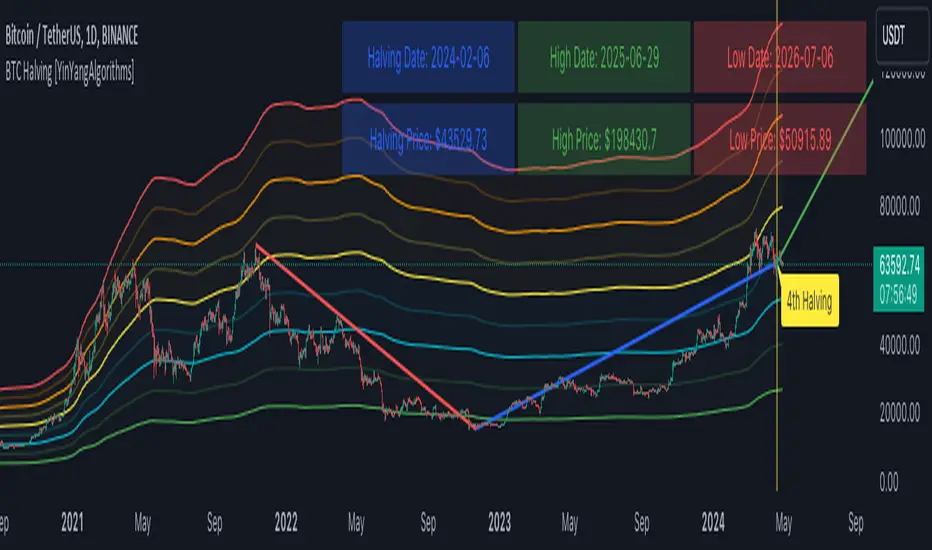
Each trajectory connects the current cycle with an estimated start, high, or low price and date. Being above or below a line can provide relative valuation context, but the price is not required to follow it.
Visualize Bitcoin-cycle projections, potential trajectory levels, and valuation zones.
Overview
BTC Halving estimates cycle start, high, and low timing and price levels from prior halving relationships, then plots trajectories and valuation zones. These are model outputs, not forecasts guaranteed to occur.
Configuration
Tutorial
Step 1
Each trajectory connects the current cycle with an estimated start, high, or low price and date. Being above or below a line can provide relative valuation context, but the price is not required to follow it.
Step 2
Fast zones adapt more quickly to parabolic movement; slow zones retain broader levels. The five states range from very oversold through neutral to very overbought and can also surface potential support or resistance.
Step 3
The model extrapolates prior halving relationships and supply/market-cap inputs. Record the version and date of any analysis, and do not present an estimated level or date as a guaranteed forecast.
Cycle dates, price levels, and trajectories are estimates derived from historical relationships. They can be wrong and should not be presented as predictions or guarantees.
Signals, projections, and strategy outputs are analytical tools—not financial advice or guarantees of future results. Trading involves substantial risk.
This guide is a rewritten YinYang overview. For the author’s complete source description and release notes, view the original publication.
Related scripts
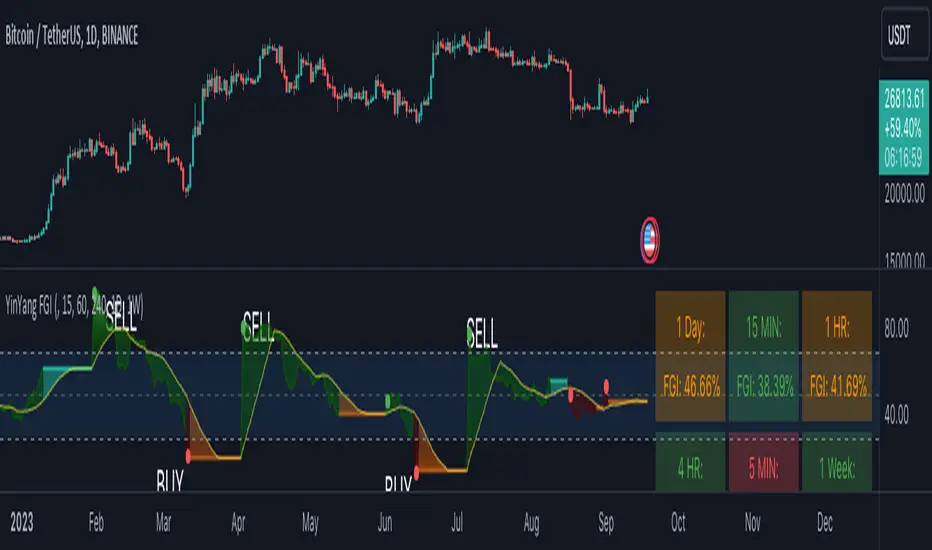
See when sentiment may be approaching fear or greed extremes across multiple timeframes.
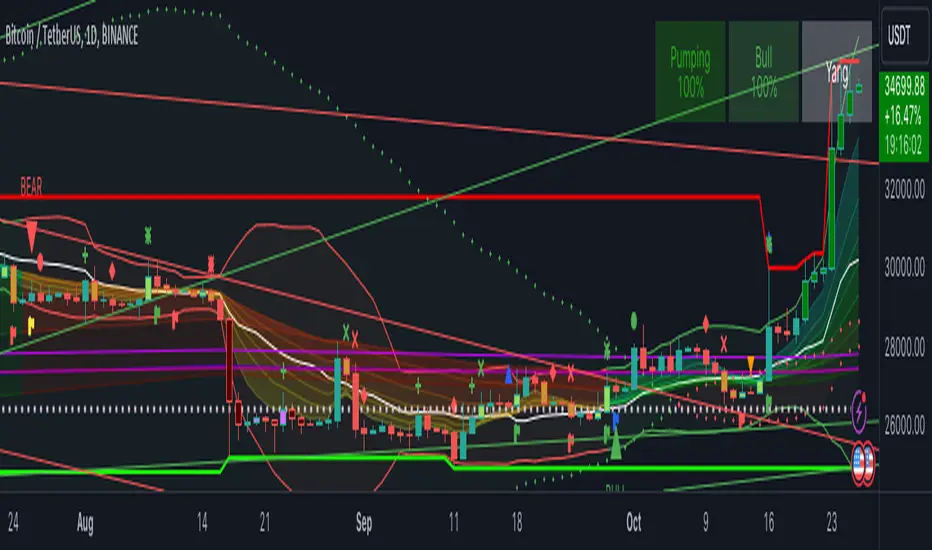
A multi-layer trend-analysis workspace built around confirmation.
Ultimate combines the web analytics platform with all six featured invite-only TradingView tools.
TradingView® is a trademark of TradingView, Inc. YinYang Algorithms is not affiliated with or endorsed by TradingView. A separate TradingView account is required; paid TradingView plans are not included.