Skip to content
YinYang
FeaturedindicatorActiveUltimate

SFX Signals & Overlays

Signals, structure, momentum, and market zones in one configurable toolkit.

AlertsSource updated 2024-06-02Reviewed 2026-07-19
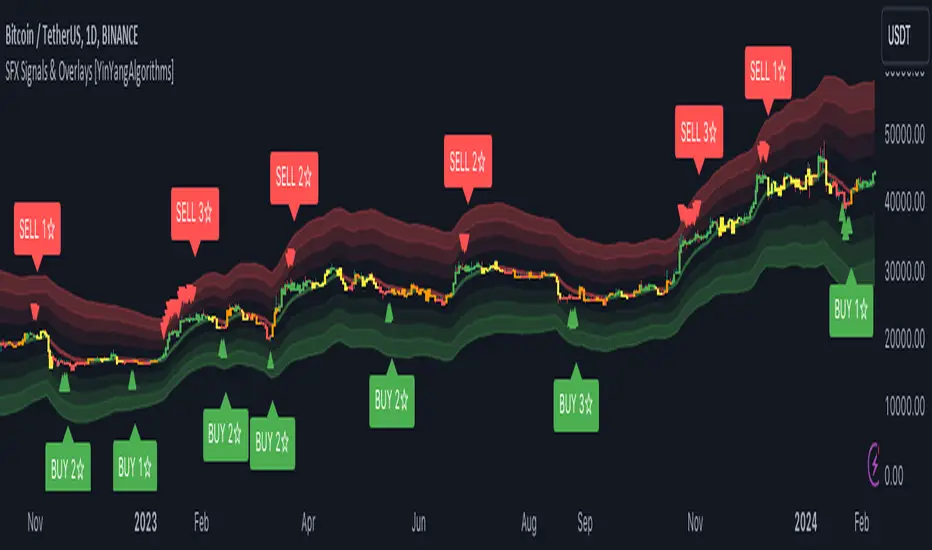
SFX Signals and Overlays displayed on a Bitcoin TradingView chart
Original YinYang TradingView publication screenshot.

Overview

Bring market structure, momentum shifts, signal evaluations, and value zones into one TradingView workspace.

SFX combines momentum-based buy and sell sequences, reversal context, trend colouring, market-structure labels, and adaptive zones so traders can evaluate several forms of confirmation without stacking unrelated scripts.

Key capabilities

  • Momentum-based buy and sell sequences
  • Reversal markers after momentum ends
  • Signal-strength evaluations
  • Trend bar colouring
  • Support, resistance, overbought, and oversold zones
  • BoS and ChoCh market-structure labels
  • Configurable sensitivity and display controls
  • TradingView alert options

Configuration

Start with the documented controls

  • Choose sensitivity independently for trend, signals, momentum, zones, and structure.
  • Control whether signals appear at the beginning, end, or both ends of a momentum sequence.
  • Show only the zones, labels, and colours that support your workflow.

Tutorial

Learn the workflow in context

Step 1

Read a momentum sequence

Treat the first signal as the beginning of a momentum evaluation, not a guaranteed entry. Continuation markers can persist while momentum remains active, followed by a reversal marker when that sequence ends.

If price consolidates after the sequence, wait for fresh confirmation: a completed momentum sequence does not dictate the next move.

  • Compare the signal with trend colour and broader structure.
  • Use signal strength as context at the moment it prints.
  • Avoid treating any single marker as a complete trading system.
Step 2

Use the market zones

The inner and outer zones identify potential support/resistance layers and provide overbought or oversold context. The empty area between them represents a more neutral region.

Sensitivity controls how quickly those zones adapt. Faster settings react to shorter movements; slower settings retain broader levels.

Step 3

Configure alerts

Create TradingView alerts from the conditions exposed by the script, then choose notification channels inside TradingView. Always verify the exact condition and timeframe before enabling an alert.

Video tutorial

Watch the tutorial

SFX Signals and Overlays Guide

Watch on YouTube

Risk and results context

Signals, projections, and strategy outputs are analytical tools—not financial advice or guarantees of future results. Trading involves substantial risk.

This guide is a rewritten YinYang overview. For the author’s complete source description and release notes, view the original publication.

Related scripts

Continue exploring the library

Ultimate

Use the complete TradingView library

Ultimate combines the web analytics platform with all six featured invite-only TradingView tools.

TradingView® is a trademark of TradingView, Inc. YinYang Algorithms is not affiliated with or endorsed by TradingView. A separate TradingView account is required; paid TradingView plans are not included.