Skip to content
YinYang
indicatorActiveOpen Source

Market Gravity

Maps inferred liquidity above and below price, scores its current attraction, and ranks the strongest active magnets.

AlertsSource updated 2026-09-27Reviewed 2026-09-29
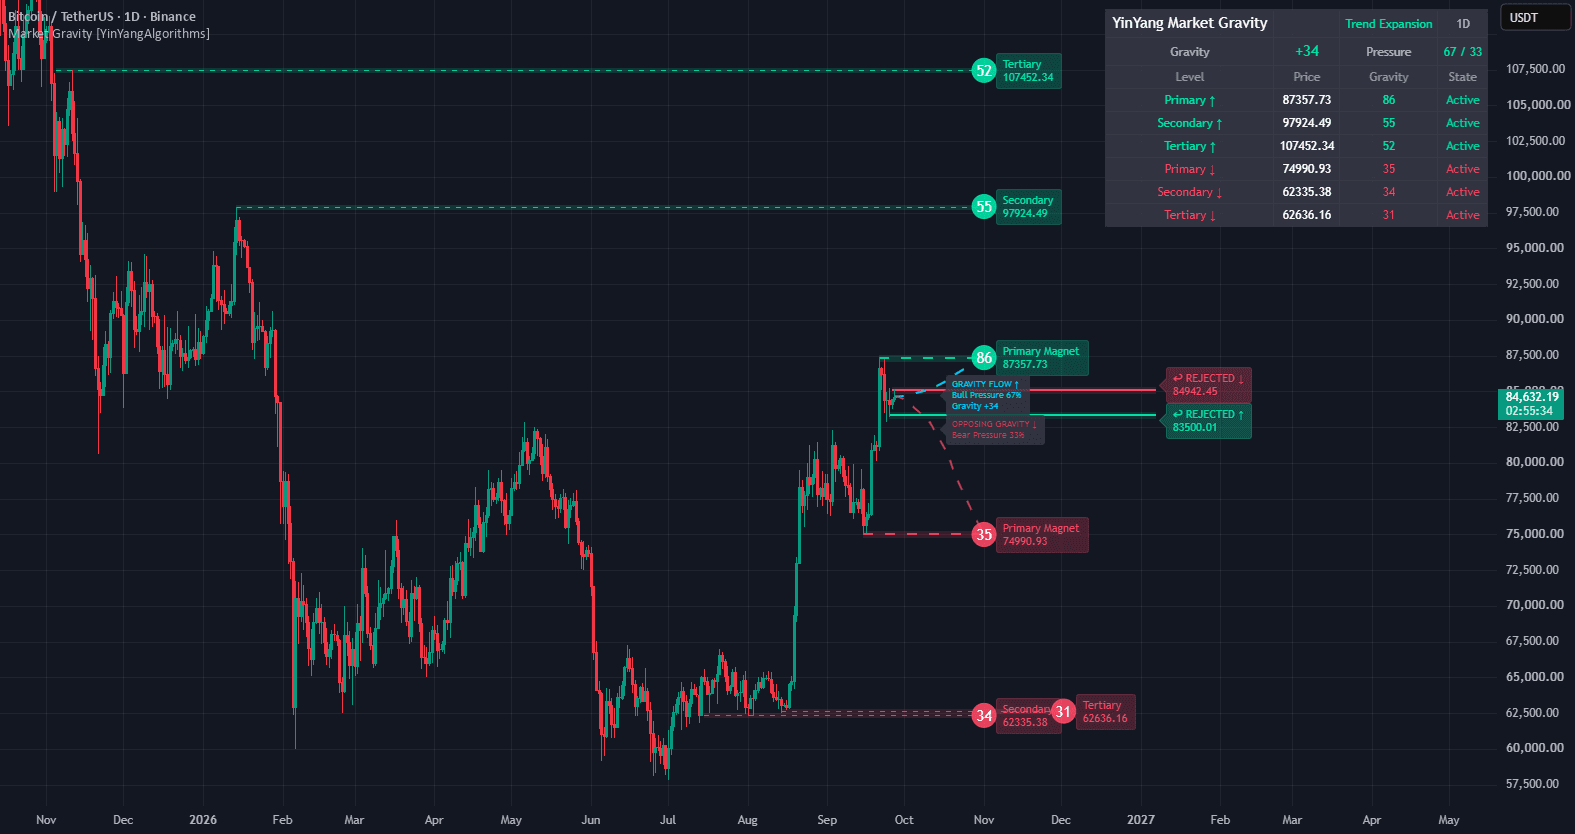
Market Gravity liquidity magnets, Gravity Flow paths, and pressure summary on a TradingView chart
Original YinYang TradingView publication screenshot.

Overview

See which inferred liquidity structures are strongest and most relevant now without treating every visible swing as an equal target.

Market Gravity is an open-source liquidity-structure indicator that builds liquidity pools from confirmed chart structure, scores each pool's structural Liquidity Strength, and then measures its current Gravity using factors such as distance, freshness, trend, volume, and market regime. It ranks the strongest active magnets on both sides of price and summarizes their competing pull through Bull/Bear Pressure, Net Gravity, and projected Gravity paths.

Key capabilities

  • Structure-derived liquidity from confirmed swings, equal highs/lows, major swings, repeated rejections, and completed previous-day/week extremes
  • ATR-normalized clustering of compatible structures into liquidity pools
  • Separate Liquidity Strength and current Gravity scoring
  • Primary, Secondary, and Tertiary magnets above and below price
  • Bull/Bear Pressure and signed Net Gravity imbalance
  • Gravity Flow and Opposing Gravity path visualization
  • Lifecycle states for approaching, sweeping, rejection, acceptance, and retirement
  • Fifteen TradingView alert conditions covering ranked magnets, thresholds, lifecycle events, and Net Gravity changes

Configuration

Start with the documented controls

  • Tune pivot confirmation, clustering, maximum target distance, and enabled liquidity sources to match the structure you want the script to evaluate.
  • Adjust Gravity inputs such as ATR, trend, volume, approaching distance, freshness, and rank weighting only after understanding how they change relative attraction.
  • Choose how many ranked levels, paths, lifecycle events, glow effects, and table details to display so the map remains readable.
  • Set the Primary Gravity and Net Gravity alert thresholds, then verify alert behavior on the intended symbol and timeframe.

Tutorial

Learn the workflow in context

Step 1

Read the liquidity map

Market Gravity builds pools from observable chart structure rather than direct order-book data. Confirmed swing highs and lows, equal highs and lows, major swings, repeated rejections, and completed previous-day or previous-week extremes can contribute evidence.

Compatible structures can cluster into one ATR-normalized pool so nearby evidence is represented as one zone instead of several nearly identical levels.

  • Liquidity Strength describes structural significance.
  • Gravity Score describes how relevant an active pool is now.
  • Primary, Secondary, and Tertiary identify the currently strongest eligible magnets on each side of price.
Step 2

Interpret Pressure, Net Gravity, and Gravity Flow

Bull and Bear Pressure show how the aggregate ranked Gravity is distributed above and below price. Net Gravity expresses the signed imbalance between those competing pulls.

Gravity Flow connects current price with the dominant Primary Magnet while Opposing Gravity highlights the strongest competing magnet. These curves visualize relative attraction; they are not forecasts of the exact candles price will print.

  • A 70% Bull Pressure reading is not a 70% probability that price rises.
  • A Gravity Score of 80 is not an 80% probability that a target is reached.
  • Positive or negative Net Gravity is an imbalance measure, not an expected return or projected move.

Step 3

Follow liquidity lifecycle

Active pools evolve as price approaches and interacts with them. Lifecycle states distinguish a developing or active magnet from liquidity that is being swept, rejected, accepted, or retired.

Confirmed pivots introduce deliberate delay: swing-derived liquidity only becomes active after the required pivot structure is confirmed.

  • Watch Approaching for a Primary Magnet becoming locally relevant.
  • Use Sweeping, Rejected, and Accepted to classify what happened after price reached a zone.
  • Expect the map to change as new structure forms, old liquidity resolves, or distance and regime conditions change.

Step 4

Create Market Gravity alerts

The publication exposes 15 TradingView alert conditions spanning Primary Magnet changes, high-Gravity thresholds, approaching events, upper/lower sweeps, rejections, acceptances, Net Gravity flips, and strong bullish/bearish Gravity thresholds.

Confirm the symbol, timeframe, threshold inputs, and alert frequency before relying on notifications. Different chart intervals can produce different liquidity maps.

Risk and results context

Market Gravity infers liquidity from observable price and volume structure. It is not direct order-book data and does not reveal hidden institutional orders or future orders.

Gravity Scores, Pressure, Net Gravity, and Gravity paths measure model structure and relative attraction—not probabilities, expected returns, guaranteed targets, or exact price paths.

Confirmed pivots introduce confirmation delay, and different chart intervals can produce different liquidity maps.

Signals, projections, and strategy outputs are analytical tools—not financial advice or guarantees of future results. Trading involves substantial risk.

This guide is a rewritten YinYang overview. For the author’s complete source description and release notes, view the original publication.

Related scripts

Continue exploring the library

Ultimate

Use the complete TradingView library

Ultimate combines the web analytics platform with all six featured invite-only TradingView tools.

TradingView® is a trademark of TradingView, Inc. YinYang Algorithms is not affiliated with or endorsed by TradingView. A separate TradingView account is required; paid TradingView plans are not included.