Skip to content
YinYang
FeaturedstrategyActiveUltimate

Machine Learning Donchian DCA Grid Strategy

A data-driven spot DCA strategy designed to accumulate lower and exit systematically.

AlertsWebhook-readySource updated 2024-05-07Reviewed 2026-07-19
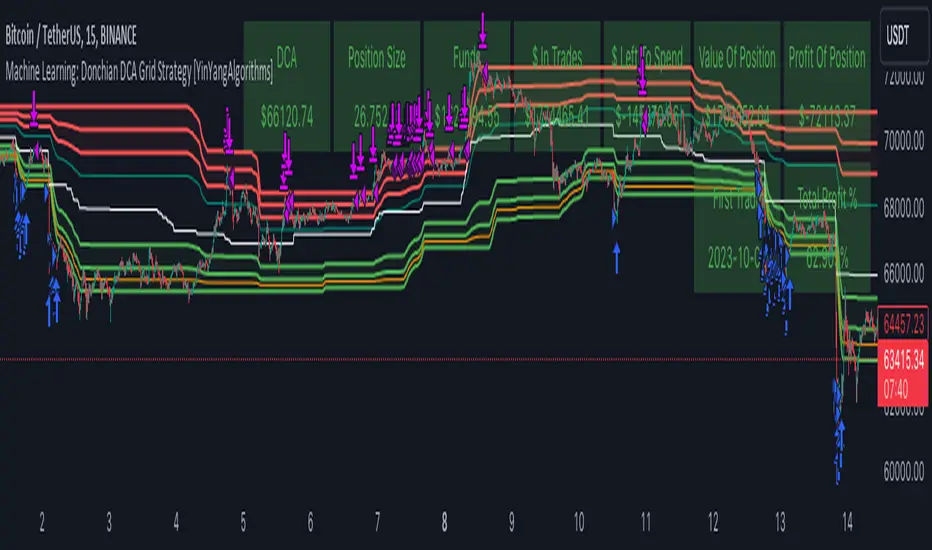
Donchian DCA Grid strategy zones on a TradingView chart
Original YinYang TradingView publication screenshot.

Overview

Explore a structured spot accumulation workflow with grid entries, DCA-aware controls, and staged exits.

This spot-focused TradingView strategy uses Donchian-style high and low zones, fractional grids, DCA controls, divergence confirmation, and several staged exit methods. The publication describes its approach as machine learning; this page does not extend that claim beyond the script’s documented behaviour.

Key capabilities

  • Donchian-derived buy and sell zones
  • Configurable fractional grids
  • Stacked grid orders when one bar crosses multiple levels
  • Purchase-more conditions when outer bounds expand
  • Optional strong-buy confirmation using EMA and divergence
  • Basis, grid, and take-profit exits
  • Only-buy-below-DCA and only-sell-in-profit controls
  • Spot-order workflow suited to TradingView alerts

Configuration

Start with the documented controls

  • Set the number of grids and capital allocated to each purchase type.
  • Configure optional strong-buy confirmation and divergence source.
  • Choose staged sell behaviour, take-profit handling, and DCA-aware safeguards.

Tutorial

Learn the workflow in context

Step 1

Understand zones and grids

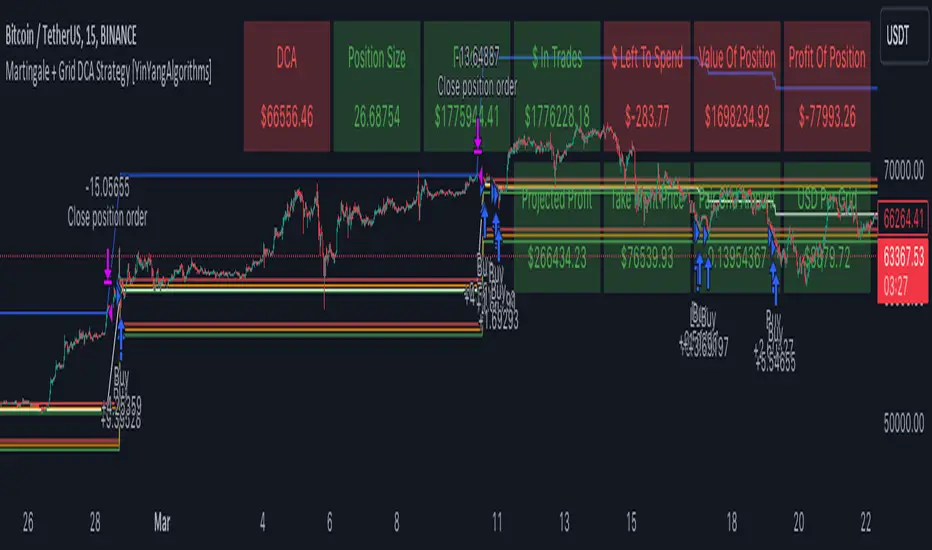
The strategy derives upper and lower areas from changing highs and lows, then divides them into grids. Crossing multiple grid levels within one bar can stack the configured order amount.

The middle of a zone can use a separate allocation, while outer-bound extensions can trigger the publication’s Purchase More behaviour.
Step 2

Review Strong Buy confirmation

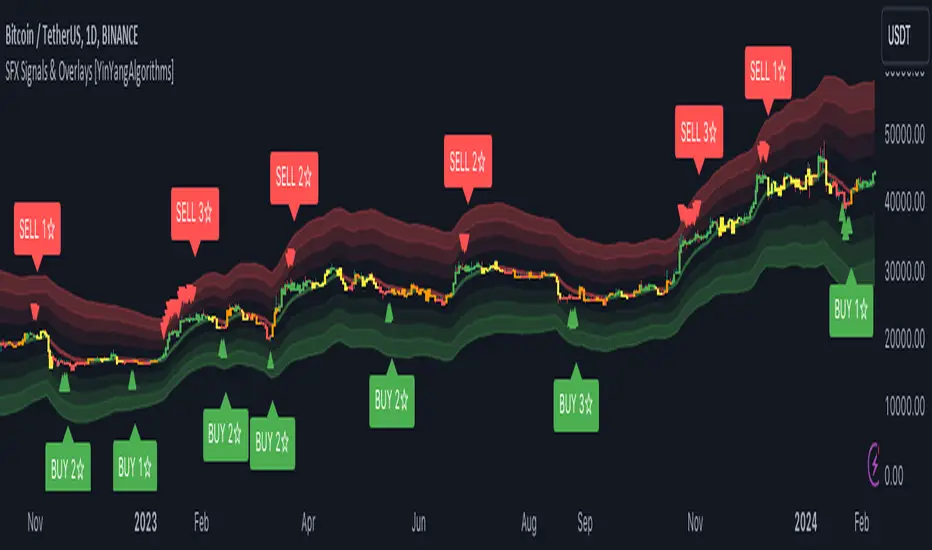
The optional Strong Buy path requires an outer-bound push, an EMA 21 crossover, and one configured divergence verification from MACD, RSI, or MACD histogram data. It is optional and should be validated for the selected symbol and timeframe.

Step 3

Configure staged exits

Sell Some can use the basis line, a percentage position inside the zones, both, or neither. Sell grids can scale out as price moves higher. Take Profit closes all remaining positions only after the documented cross-and-close condition.

Step 4

Connect an automation workflow

Create the strategy alert in TradingView, verify its payload, and send it to a compatible webhook execution service. TradingView and the execution service are separate products; start with paper or sandbox testing where available.

Risk and results context

Strategy reports are historical and hypothetical. Results can change materially with symbol, timeframe, date range, settings, commission, slippage, liquidity, and execution conditions.

Signals, projections, and strategy outputs are analytical tools—not financial advice or guarantees of future results. Trading involves substantial risk.

No numerical performance claim is presented here because symbol, timeframe, tested date range, settings, commission, and slippage must be shown together. Review those parameters inside TradingView before interpreting any strategy report.

This guide is a rewritten YinYang overview. For the author’s complete source description and release notes, view the original publication.

Related scripts

Continue exploring the library

Ultimate

Use the complete TradingView library

Ultimate combines the web analytics platform with all six featured invite-only TradingView tools.

TradingView® is a trademark of TradingView, Inc. YinYang Algorithms is not affiliated with or endorsed by TradingView. A separate TradingView account is required; paid TradingView plans are not included.